













 The Marketing Minute: When Everyone Is a Thought Leader, No One Is
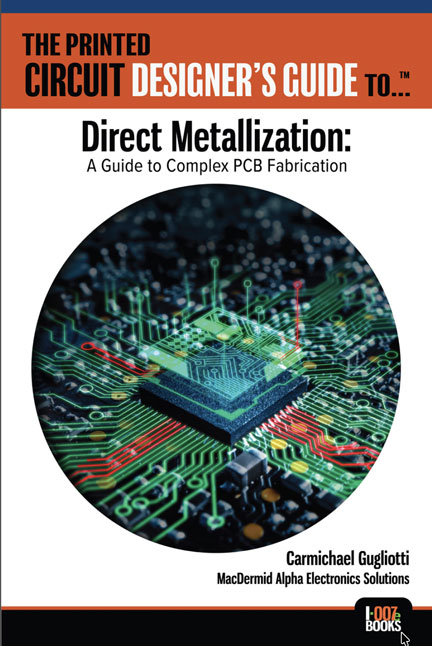
 The Chemical Connection: More Solutions to Common PCB Etching Questions
 It’s Only Common Sense: How to Demonstrate Grace Under Pressure During Tough Times





The Conference Board Leading Economic Index (LEI) for the U.S. increased 0.4% in August to 111.2 (2016 = 100), following a 0.7% increase in July, and a 0.5% increase in June. The leading economic index is now well above its previous peak (March 2006, 102.4).
“The leading indicators are consistent with a solid growth scenario in the second half of 2018 and at this stage of a maturing business cycle in the US, it doesn’t get much better than this,” said Ataman Ozyildirim, director of Business Cycles and Growth Research at The Conference Board. “The US LEI’s growth trend has moderated since the start of the year. Industrial companies that are more sensitive to the business cycle should be on the lookout for a possible moderation in economic growth in 2019. The strengths among the LEI’s components were very widespread, further supporting an outlook of above 3.0% growth for the remainder of 2018.”
The Conference Board Coincident Economic Index (CEI) for the U.S. increased 0.2% in August to 104.3 (2016 = 100), following a 0.2% increase in July, and a 0.3% increase in June.
The Conference Board Lagging Economic Index (LAG) for the U.S. increased 0.2% in August to 105.4 (2016 = 100), following a 0.2% decline in July and a 0.2% increase in June.
About The Conference Board Leading Economic Index (LEI) for the U.S.
The composite economic indexes are the key elements in an analytic system designed to signal peaks and troughs in the business cycle. The leading, coincident, and lagging economic indexes are essentially composite averages of several individual leading, coincident, or lagging indicators. They are constructed to summarize and reveal common turning point patterns in economic data in a clearer and more convincing manner than any individual component – primarily because they smooth out some of the volatility of individual components.