-

- News
- Books
Featured Books
- pcb007 Magazine
Latest Issues
Current Issue
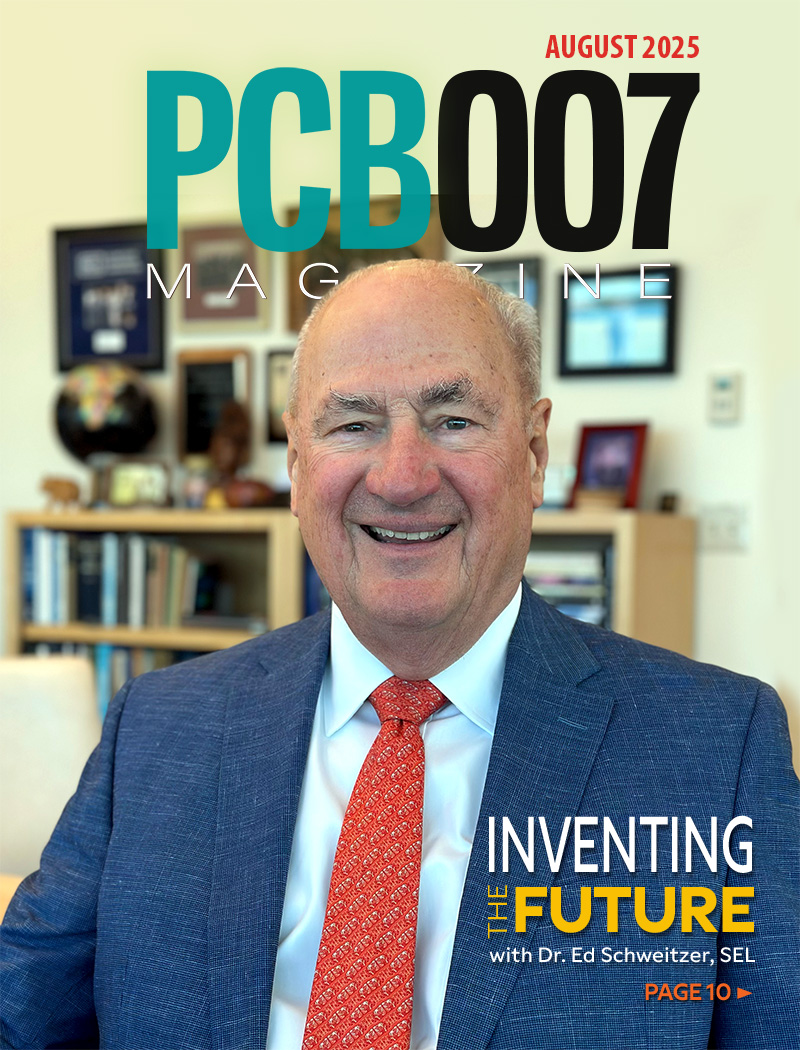
Inventing the Future with SEL
Two years after launching its state-of-the-art PCB facility, SEL shares lessons in vision, execution, and innovation, plus insights from industry icons and technology leaders shaping the future of PCB fabrication.

Sales: From Pitch to PO
From the first cold call to finally receiving that first purchase order, the July PCB007 Magazine breaks down some critical parts of the sales stack. To up your sales game, read on!

The Hole Truth: Via Integrity in an HDI World
From the drilled hole to registration across multiple sequential lamination cycles, to the quality of your copper plating, via reliability in an HDI world is becoming an ever-greater challenge. This month we look at “The Hole Truth,” from creating the “perfect” via to how you can assure via quality and reliability, the first time, every time.
- Articles
- Columns
- Links
- Media kit
||| MENU - pcb007 Magazine
Nano Dimension Reports 1,268% Revenue Increase in 2Q22
September 1, 2022 | Nano Dimension Ltd.Estimated reading time: 6 minutes
Nano Dimension Ltd., a leading supplier of Additively Manufactured Electronics (AME) and multi-dimensional metal & ceramic Additive Manufacturing (AM) 3D printers, announced financial results for the second quarter ended June 30th, 2022.
Nano Dimension reported revenues of $11.1 million for the second quarter of 2022, an increase of 1,268% over the same quarter in 2021.
Revenues for the six months period ended June 30th, 2022, were $21.5 million, which represent a 1,227% increase over the six months period ended June 30th, 2021. Revenues for Q2/2022 were 6% over Q1/2022.
The Company ended the quarter with a cash, short-term investment and deposits balance of $1.27 billion (including securities and short and long-term unrestricted bank deposits), while net loss for the second quarter was $40 million and Adjusted EBITDA was negative $21.3 million.
- Highlighted results for Q2/2022 were:
- Net loss of $40 million includes $10.9 million non-cash adjustments for share-based payments and depreciation and amortization expenses.
- Gross margin (excluding amortization of intangible assets, also recognized in business combination) was 36%.
- Adjusted EBITDA was negative $21.3 million.
- Adjusted EBITDA includes $12.9 million of R&D cash expenses.
- Net cash used in operations during the second quarter of 2022 was $21.9 million.
- Details regarding EBITDA and Adjusted EBITDA can be found later in this press release under “Non-IFRS measures.”
CEO MESSAGE TO SHAREHOLDERS:
The efforts of our newly assembled Go-To-Market organization are indeed showing results, manifested by an impressive growth in revenue. It includes Nano Dimension’s network of marketing, sales, pre and post sales application engineers and customer care engineers across Europe and the U.S. Their efforts are indeed substantial and effective, especially with the occurrences of unforeseen events, especially the slowdown in Europe resulting from the industrial players’ reaction to the evolving war in Ukraine as well as the crisis in electronic components’ supply chain.
We see our role to either prepare for unpredicted circumstances, or at least to react to them swiftly. As part of this commitment to act, in mid-August 2022, we replaced our President of the Americas with Mr. Dale Baker. Dale, an ex-General Electric executive and ex-CEO of seven companies, has worked with us before in similar roles in other exponential growth situations. Dale is already heading the expansion of Nano Dimension’s U.S. operations as well as taking the leadership role in AME worldwide sales and marketing activity and gearing up to execute the Company’s current organic and M&A growth strategy chain
Our vision continues to evolve as we look to transform AM, AM Electronics & adjacent industrial non-digitized sectors into an environmentally friendly & economically efficient additive manufacturing Industry 4.0 – enabling a one production-step-conversion of digital designs into functioning mechanical & electronic devices, on-demand, anytime, anywhere. We aim to build an ecofriendly and intelligent distributed secured network of 3D printers & roll-in adjacent industrial machine-learning-led-digitized manufacturing and self-learning and self-improving machines.
As we have mentioned in the last quarter, the business plan aimed at reaching the above has been expanded with a wider field of view, to fit new arising opportunities. If contraction of multiples and valuations will be sustained, we expect to take advantage of our frugal approach to cash management during the unreasonable “market-inflation” during 2020 to early 2022.
Indeed, in early Q3/2022 we leveraged the shrinking valuations and bought Admatec Europe B.V. and Formatec Technical Ceramics B.V. in Europe (a leading developer and manufacturer of 3D metal/ceramic printing systems and a service provider for ceramic/metal end-user parts), at approximately 2.5 times revenue. We have also established ourselves, at a value of approximately 2 times revenue, as a shareholder of Stratasys Ltd. (Nasdaq: SSYS), in a strategic investment (which may be increased or decreased, subject to market conditions and other economic factors). If acquisitions will withstand more reasonable prices, which have not been available over the last two years, we hope to show attractive synergistic growth from M&A activity.
FINANCIAL RESULTS:
Second Quarter 2022 Financial Results
Total revenues for the second quarter of 2022 were $11,101,000, compared to $10,430,000 in the first quarter of 2022, and $811,000 in the second quarter of 2021. The increase is attributed to increased sales of the Group’s product lines.
Cost of revenues (excluding amortization of intangibles) for the second quarter of 2022 was $7,151,000, compared to $6,580,000 in the first quarter of 2022, and $332,000 in the second quarter of 2021. The increase is attributed mostly to the increased sales of the Group’s product lines.
Research and development (R&D) expenses for the second quarter of 2022 were $18,365,000, compared to $17,870,000 in the first quarter of 2022, and $9,129,000 in the second quarter of 2021. The increase compared to the first quarter of 2022 is attributed to an increase in materials and subcontractors expenses, as well as increase in depreciation expenses, partially offset by a decrease in share-based payment expenses. The increase compared to the second quarter of 2021 is attributed mainly to an increase in payroll expenses, subcontractors expenses and share-based payment expenses, as a result of the Company’s increased R&D efforts.
The R&D expenses net of depreciation and share-based payments expenses were $12,944,000.
Sales and marketing (S&M) expenses for the second quarter of 2022 were $10,115,000, compared to $9,308,000 in the first quarter of 2022, and $6,009,000 in the second quarter of 2021. The increase is attributed mainly to an increase in payroll expenses as a result of the Group’s growing sales and marketing team.
The S&M expenses net of depreciation and share-based payments expenses were $7,289,000.
General and administrative (G&A) expenses for the second quarter of 2022 were $7,207,000, compared to $6,742,000 in the first quarter of 2022, and $4,906,000 in the second quarter of 2021. The increase compared to the first quarter of 2022 is attributed to an increase in office and rent and related expenses, as well as an increase in share-based payments expenses, partially offset by a decrease in professional services. The increase compared to the second quarter of 2021 is attributed to an increase in payroll expenses.
The G&A expenses net of depreciation and share-based payments expenses were $5,373,000.
Net loss attributed to the owners for the second quarter of 2022 was $39,732,000, or $0.15 per share, compared to $33,093,000, or $0.13 per share, in the first quarter of 2022, and $13,602,000, or $0.05 per share, in the second quarter of 2021.
Six Months Ended June 30 2022, Financial Results
Total revenues for the six months period ended June 30, 2022, were $21,531,000, compared to $1,622,000 in the six months period ended June 30, 2021. The increase is attributed to increased sales of the Group’s product lines.
Cost of revenues (excluding amortization of intangibles) for the six months period ended June 30, 2022, was $13,731,000, compared to $684,000 in the six months period ended June 30, 2021. The increase is attributed mostly to increased sales of the Group’s product lines
R&D expenses for the six months period ended June 30, 2022, were $36,235,000, compared to $12,861,000 in the six months period ended June 30, 2021. The increase is attributed to an increase in payroll and subcontractors expenses as well as an increase in share-based payment expenses, as a result of the Group’s increased R&D efforts
The R&D expenses for the six months period ended June 30, 2022, net of depreciation and share-based payments expenses, were $24,667,000
S&M expenses for the six months period ended June 30, 2022, were $19,423,000, compared to $8,722,000 in the six months period ended June 30, 2021. The increase is attributed to an increase in payroll and marketing expenses as well as an increase in share-based payment expenses as a result of the Group’s growing sales and marketing team
The S&M expenses for the six months period ended June 30, 2022, net of depreciation and share-based payments expenses, were $13,682,000.
G&A expenses for the six months period ended June 30, 2022, were $13,949,000, compared to $8,331,000 in the six months period ended June 30, 2021. The increase is attributed to an increase in payroll expenses as well as an increase in office and rent and related expenses.
The G&A expenses for the six months period ended June 30, 2022, net of depreciation and share-based payments expenses, were $10,592,000.
Net loss attributed to the owners for the six months period ended June 30, 2022, was $72,825,000, or $0.28 per share, compared to $22,916,000, or $0.10 per share, in the six months period ended June 30, 2021.
Balance Sheet Highlights
Cash and cash equivalents, together with short and long-term bank deposits totaled $1,246,015,000 as of June 30th, 2022, compared to $1,355,595,000 as of December 31st, 2021. The decrease compared to December 31st, 2021, mainly reflects cash used in operating activities and investing activities.
Shareholders’ equity totaled $1,291,415,000 as of June 30th, 2022, compared to $1,343,356,000 as of December 31st, 2021.
Testimonial
"Our marketing partnership with I-Connect007 is already delivering. Just a day after our press release went live, we received a direct inquiry about our updated products!"
Rachael Temple - AlltematedSuggested Items
Eltek Ltd. Reports Strong Second-Quarter 2025 Results
08/14/2025 | PR NewswireEltek Ltd., a global manufacturer and supplier of technologically advanced solutions in the field of printed circuit boards (PCBs), today announced its financial results for the quarter ended June 30, 2025.
Element Solutions Inc Reports Strong Growth in Second Quarter 2025 Financial Results
08/01/2025 | Element Solutions Inc.Element Solutions Inc, a global and diversified specialty chemicals company, today announced its financial results for the three and six months ended June 30, 2025.
DigiKey Expands Inventory with Over 32,000 Stocking NPIs in Q2 2025
07/31/2025 | Digi-KeyDigiKey, the leading global electronic components and automation products distributor, extensively expanded its in-stock products available for same-day shipment by adding more than 32,000 innovative new product introductions (NPIs) in the second quarter of 2025.
PC AIB Shipments Follow Seasonality, Show Nominal Increase for Q4’24
06/06/2025 | JPRAccording to a new research report from the analyst firm Jon Peddie Research, the growth of the global PC-based graphics add-in board market reached 9.2 million units in Q1'25 and desktop PC CPUs shipments decreased to 17.8 million units.
Nordson Reports Q2 Fiscal 2025 Results and Q3 Guidance
05/30/2025 | BUSINESS WIRENordson Corporation reported results for the fiscal second quarter ended April 30, 2025. Sales were $683 million compared to the prior year’s second quarter sales of $651 million.


