-

- News
- Books
Featured Books
- pcb007 Magazine
Latest Issues
Current Issue
The Legislative Outlook: Helping or Hurting?
This month, we examine the rules and laws shaping the current global business landscape and how these factors may open some doors but may also complicate business operations, making profitability more challenging.

Advancing the Advanced Materials Discussion
Moore’s Law is no more, and the advanced material solutions to grapple with this reality are surprising, stunning, and perhaps a bit daunting. Buckle up for a dive into advanced materials and a glimpse into the next chapters of electronics manufacturing.

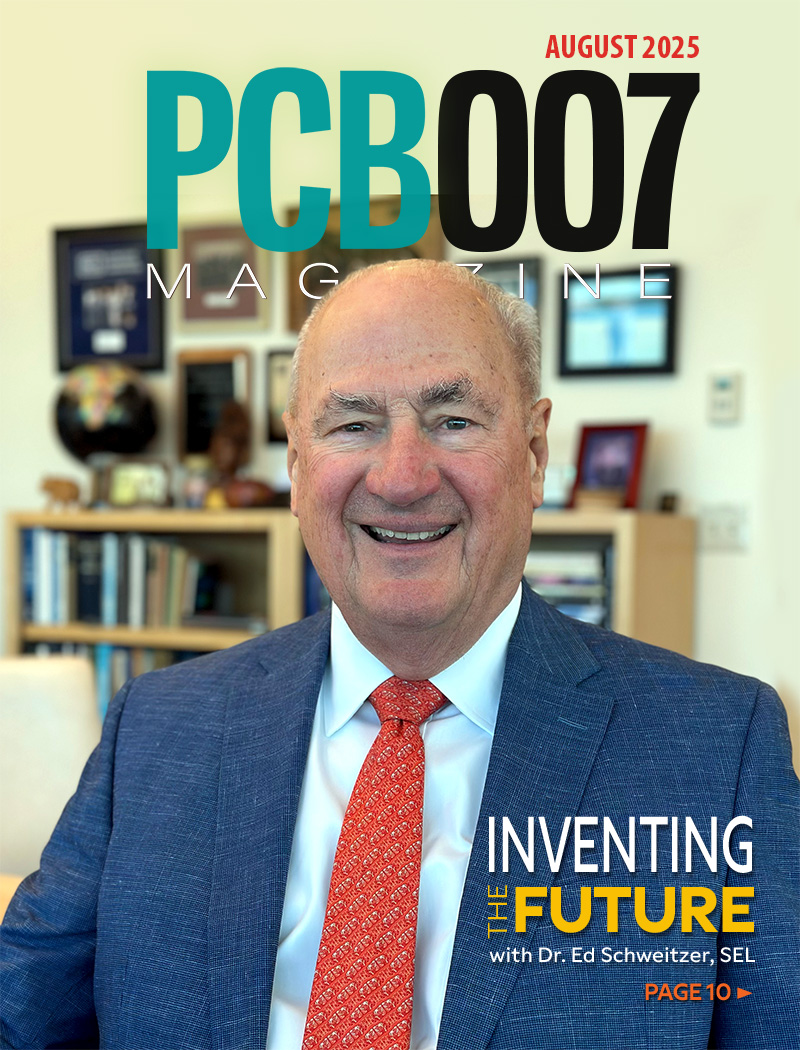
Inventing the Future With SEL
Two years after launching its state-of-the-art PCB facility, SEL shares lessons in vision, execution, and innovation, plus insights from industry icons and technology leaders shaping the future of PCB fabrication.
- Articles
- Columns
- Links
- Media kit
||| MENU - pcb007 Magazine
Nano Dimension Announced Q3 2022 Revenue of $10M & Record Backlog
December 1, 2022 | Nano DimensionEstimated reading time: 6 minutes
Nano Dimension Ltd, an industry leader in Additively Manufactured Electronics, additive PCB assembly & printhead drivers and software (AME), and a supplier of Additive Manufacturing machines and materials (AM), announced financial results for the third quarter ended September 30th, 2022.
Nano Dimension reported revenues of $10M for the third quarter of 2022, an increase of 646% over the same quarter in 2021 and 10% less than Q2/2022. Moreover, the 3rd quarter of 2022 revenue run-rate indicates the potential for growth of approximately 300% in full year 2022 over 2021. If this occurs, the Company’s revenue will be growing over 10 times from 2020 to 2022, assuming no critical changes in the world economy resulting from current international affairs and/or other factors.
Revenues for the nine months period ended September 30th, 2022, were $31.5M, which represent a 964% increase over the nine months period ended September 30th, 2021.
Total loss before tax for the 3rd quarter of 2022 was $67.1M.
Adjusted EBITDA for the 3rd quarter of 2022 was negative $24.2M, excluding $42.9M of non-cash adjustments for finance expenses/income for revaluation of assets and liabilities, share-based payments, exchange rate differences, interest income and depreciation and amortization expenses.
- Adjusted EBITDA as above includes R&D cash expenses of $13.5M.
- Net cash used in operations during the 3rd quarter of 2022 was $22.3M.
- Details regarding EBITDA and Adjusted EBITDA can be found later in this press release under “Non-IFRS measures.”
Yoav Stern, Chairman & CEO, comments: “The comparable increases of revenue of Q3 2022 over Q3 2021 (646%) and year-to-date over last-year-year-to-date (964%) - highlight the business’ continued success in growing dramatically, better than our expectations as expressed last year. We also finished the third quarter with a record backlog of approximately $9M.
All our product lines’ revenue grew organically exceptfor additive electronics machines in Europe: As a result of the Russia-Ukraine war, our revenues in Russia and Poland were reduced in the first 9 months of 2022 by approximately $1.5M (75%) compared to the same period in 2021. Additionally, we understand from other customers there that the continued components’ supply chainshortages have caused them to request a delay in delivery of additive electronic machines (which are used to mount those delayed components).
Sales and deliveries in the USA of similar machines grew organically by 45% over the 9 months ended September 30th, 2022, compared to the similar period in 2021.
The Gross Margin is a bit lower than we have anticipated, which is a result of the above mentioned held-back deliveries in Europe without reducing the fixed manufacturing overhead. The inherent gross margin of that technology is above 30%, as it has been for years, and it is within the typical range for that industry segment. We sold 69 machines of this kind since 1-1-2022. The Q3/2022 lower gross margin is also a result of trading up old AME machines with new ones, which are transactions at lower gross margins than the regular new AME machine sales.”
Financial Results:
Third Quarter 2022 Financial Results
Total revenues for the third quarter of 2022 were $9,998,000, compared to $11,101,000 in the second quarter of 2022, and $1,340,000 in the third quarter of 2021. The decrease compared to the second quarter of 2022 was influenced by the conflict in Europe and supply chain delays, as explained above. The increase compared to the third quarter of 2021 is attributed to increased sales of the Company’s product lines.
Cost of revenues (excluding amortization of intangibles) for the third quarter of 2022 was $7,428,000, compared to $7,151,000 in the second quarter of 2022, and $696,000 in the third quarter of 2021. The increase is attributed mostly to the increased sales of the Company’s product lines.
Research and development (R&D) expenses for the third quarter of 2022 were $18,535,000, compared to $18,365,000 in the second quarter of 2022, and $13,726,000 in the third quarter of 2021. The increase compared to the second quarter of 2022 is attributed to an increase in materials and subcontractors’ expenses, as well as an increase in depreciation expenses, partially offset by a decrease in share-based payment expenses. The increase compared to the third quarter of 2021 is attributed mainly to an increase in payroll expenses and subcontractors expenses and is partially offset by a decrease in depreciation and share-based payment expenses.
The R&D expenses includes depreciation and share-based payments expenses of $5,057,000.
Sales and marketing (S&M) expenses for the third quarter of 2022 were $9,652,000, compared to $10,115,000 in the second quarter of 2022, and $6,301,000 in the third quarter of 2021. The decrease compared to the second quarter of 2022 is attributed mainly to the decrease in marketing and share-based payment expenses, partially offset by an increase in payroll expenses. The increase compared to the third quarter of 2021 is attributed mainly to an increase in payroll and marketing related expenses as well as an increase in depreciation, partially offset by a decrease in share-based payment expenses.
The S&M expenses includes depreciation and share-based payments expenses of $1,941,000.
General and administrative (G&A) expenses for the third quarter of 2022 were $7,417,000, compared to $7,207,000 in the second quarter of 2022, and $4,843,000 in the third quarter of 2021. The increase compared to the third quarter of 2021 is attributed to an increase in payroll and professional services due to the Company’s latest acquisitions, as well as an increase in office expenses.
The G&A expenses includes depreciation and share-based payments expenses of $1,604,000.
Net loss attributed to the owners for the third quarter of 2022 was $66,931,000, or $0.26 per share, compared to $39,732,000, or $0.15 per share, in the second quarter of 2022, and $18,237,000 or $0.07 per share, in the third quarter of 2021.
Adjusted EBITDA for the 3rd quarter of 2022 was negative $24.2M, excluding $42.9M of non-cash adjustments for finance expenses/income for revaluation of assets and liabilities, share-based payments, exchange rate differences, and depreciation and amortization expenses.
Nine Months Ended September 30 2022, Financial Results
Total revenues for the nine months period ended September 30th, 2022, were $31,529,000, compared to $2,962,000 in the nine months period ended September 30th, 2021. The increase is attributed to increased sales of the Company’s product lines.
Cost of revenues (excluding amortization of intangibles) for the nine months period ended September 30th, 2022, was $21,159,000, compared to $1,380,000 in the nine months period ended September 30th, 2021. The increase is attributed mostly to increased sales of the Company’s product lines.
R&D expenses for the nine months period ended September 30th, 2022, were $54,770,000, compared to $26,587,000 in the nine months period ended September 30, 2021. The increase is attributed to an increase in payroll and subcontractors’ expenses as well as an increase in share-based payment expenses, as a result of the Company’s increased R&D efforts.
The R&D expenses for the nine months period ended September 30th, 2022 includes depreciation and share-based payments expenses of $16,625,000.
S&M expenses for the nine months period ended September 30, 2022, were $29,075,000, compared to $15,023,000 in the nine months period ended September 30, 2021. The increase is attributed to an increase in payroll and marketing expenses as well as an increase in share-based payment expenses as a result of the Company’s growing sales and marketing team.
The S&M expenses for the nine months period ended September 30th, 2022 includes depreciation and share-based payments expenses of $7,682,000.
G&A expenses for the nine months period ended September 30th, 2022, were $21,366,000, compared to $13,174,000 in the nine months period ended September 30th, 2021. The increase is attributed to an increase in payroll expenses as well as an increase in office and rent and related expenses, and professional services.
The G&A expenses for the nine months period ended September 30th, 2022 includes depreciation and share-based payments expenses of $4,962,000.
Net loss attributed to the owners for the nine months period ended September 30th, 2022, was $139,756,000, or $0.54 per share, compared to $41,153,000, or $0.17 per share, in the nine months period ended September 30th, 2021.
Adjusted EBITDA for the nine months period ended September 30th, 2022 was negative $64.7M, excluding $76.5M of non-cash adjustments for finance expenses/income for revaluation of assets and liabilities, share-based payments, exchange rate differences, and depreciation and amortization expenses.
Balance Sheet Highlights
Cash and cash equivalents, together with short and long-term unrestricted bank deposits totaled $1,048,712,000 as of September 30th, 2022, compared to $1,355,595,000 as of December 31st, 2021. The decrease compared to December 31st, 2021, mainly reflects cash used in operating activities and investing activities.
Testimonial
"We’re proud to call I-Connect007 a trusted partner. Their innovative approach and industry insight made our podcast collaboration a success by connecting us with the right audience and delivering real results."
Julia McCaffrey - NCAB GroupSuggested Items
Hon Hai Sales Jump 11% on AI Server Boom, Boosting Nvidia Supply Chain
10/07/2025 | I-Connect007 Editorial TeamNvidia Corp.’s key server production partner, Hon Hai Precision Industry Co., reported an 11% year-on-year rise in quarterly sales on October 5, underscoring sustained global demand for artificial intelligence (AI) infrastructure, Bloomberg reported.
Eltek Ltd. Reports Strong Second-Quarter 2025 Results
08/14/2025 | PR NewswireEltek Ltd., a global manufacturer and supplier of technologically advanced solutions in the field of printed circuit boards (PCBs), today announced its financial results for the quarter ended June 30, 2025.
Element Solutions Inc Reports Strong Growth in Second Quarter 2025 Financial Results
08/01/2025 | Element Solutions Inc.Element Solutions Inc, a global and diversified specialty chemicals company, today announced its financial results for the three and six months ended June 30, 2025.
DigiKey Expands Inventory with Over 32,000 Stocking NPIs in Q2 2025
07/31/2025 | Digi-KeyDigiKey, the leading global electronic components and automation products distributor, extensively expanded its in-stock products available for same-day shipment by adding more than 32,000 innovative new product introductions (NPIs) in the second quarter of 2025.
PC AIB Shipments Follow Seasonality, Show Nominal Increase for Q4’24
06/06/2025 | JPRAccording to a new research report from the analyst firm Jon Peddie Research, the growth of the global PC-based graphics add-in board market reached 9.2 million units in Q1'25 and desktop PC CPUs shipments decreased to 17.8 million units.


