-

- News
- Books
Featured Books
- pcb007 Magazine
Latest Issues
Current Issue
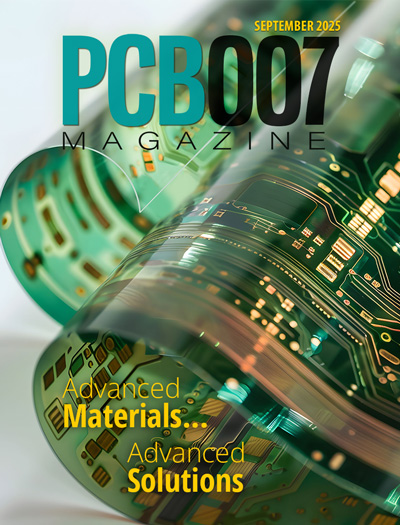
Advancing the Advanced Materials Discussion
Moore’s Law is no more, and the advanced material solutions to grapple with this reality are surprising, stunning, and perhaps a bit daunting. Buckle up for a dive into advanced materials and a glimpse into the next chapters of electronics manufacturing.

Inventing the Future With SEL
Two years after launching its state-of-the-art PCB facility, SEL shares lessons in vision, execution, and innovation, plus insights from industry icons and technology leaders shaping the future of PCB fabrication.

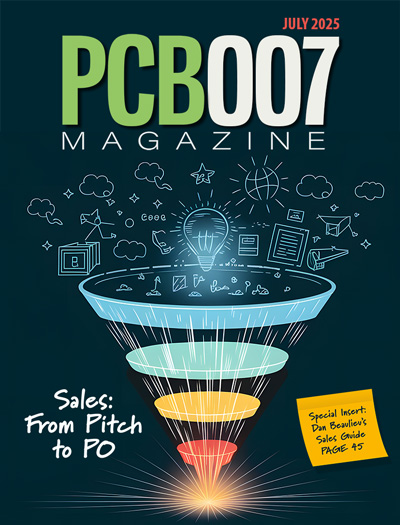
Sales: From Pitch to PO
From the first cold call to finally receiving that first purchase order, the July PCB007 Magazine breaks down some critical parts of the sales stack. To up your sales game, read on!
- Articles
- Columns
- Links
- Media kit
||| MENU - pcb007 Magazine
Happy’s Essential Skills: Project/Program Management
July 27, 2016 | Happy HoldenEstimated reading time: 13 minutes
Step 1: Identify Essential Tasks
Gantt charts don't give useful information unless they include all of the activities needed for a project or project phases to be completed. So, to start, list all of these activities. Use a work breakdown structure if you need to establish what the tasks are. Then, for each task, note its earliest start date and its estimated duration.
Step 2: Identify Task Relationships
The chart shows the relationship between the tasks in a project. Some tasks will need to be completed before you can start the next one, and others can't end until preceding ones have ended. For example, if you're creating a brochure, you need to finish the design before you can send it to print.
These dependent activities are called “sequential” or "linear" tasks. Other tasks will be “parallel” (i.e., they can be done at the same time as other tasks). You don't have to do these in sequence, but you may sometimes need other tasks to be finished first. So, for example, the design of your brochure could begin before the text has been edited (although you won't be able to finalize the design until the text is perfect).
Identify which of your project's tasks are parallel, and which are sequential. Where tasks are dependent on others, note down the relationship between them. This will give you a deeper understanding of how to organize your project, and it will help when you start scheduling activities on the chart.
Note that in Gantt charts, there are three main relationships between sequential tasks:
- Finish to Start (FS)—FS tasks can't start before a previous (and related) task is finished. However, they can start later.
- Start to Start (SS)—SS tasks can't start until a preceding task starts. However, they can start later.
- Finish to Finish (FF)—FF tasks can't end before a preceding task ends. However, they can end later.
- Start to Finish (SF), a fourth type, is very rare.
Step 3: Input Activities into Software or a Template
You can draw your charts by hand or use specialist software, such as Gantt, Matchware or Microsoft Project. Some of these tools are cloud-based, meaning that you and your team can access the document simultaneously from any location. (This helps a lot when you're discussing, optimizing, and reporting on a project.) Several Gantt templates have been created for Microsoft Excel, and you can also find free templates with a quick search online.
TimeLine
The timeline uses the same inputs as a Gantt Chart but displays the information on one or a series of timelines, drawn to the scale of the time axis[1].
PERT Chart
A PERT chart is a project management tool used to schedule, organize, and coordinate tasks within a project. The acronym PERT stands for Program Evaluation Review Technique, a methodology developed by the U.S. Navy in the 1950s to manage Adm. Hyman Rickover’s Polaris submarine missile program. A similar methodology, the Critical Path Method (CPM) was developed for project management in the private sector at about the same time.
A PERT chart presents a graphic illustration of a project as a network diagram consisting of numbered nodes (either circles or rectangles) representing events, or milestones in the project linked by labelled vectors (directional lines) representing tasks in the project. The direction of the arrows on the lines indicates the sequence of tasks.
In Figure 3, for example, the tasks between nodes 1, 2, 4, 8, and 10 must be completed in sequence. These are called dependent or serial tasks. The tasks between nodes 1 and 2, and nodes 1 and 3 are not dependent on the completion of one to start the other and can be undertaken simultaneously. These tasks are called parallel or concurrent tasks.
Tasks that must be completed in sequence but that don't require resources or completion time are considered to have event dependency. These are represented by dotted lines with arrows and are called dummy activities. For example, the dashed arrow linking nodes 6 and 9 indicates that the system files must be converted before the user test can take place, but that the resources and time required to prepare for the user test (writing the user manual and user training) are on another path. Numbers on the opposite sides of the vectors indicate the time allotted for the task.
The PERT chart is sometimes preferred over the Gantt Chart because it clearly illustrates task dependencies. On the other hand, the PERT chart can be much more difficult to interpret, especially on complex projects. Frequently, project managers use both techniques.
The process for creating a PERT Chart is:
Step 1: Identify Essential Tasks
PERT charts don't give useful information unless they include all of the activities needed for a project or project phases to be completed. To start, list all of these activities. Use a work breakdown structure if you need to establish what the tasks are. Then, for each task, note its earliest start date, estimate the shortest possible time each activity will take, the most likely length of time, and the longest time that might be taken if the activity takes longer than expected. Use the formula below to calculate the time to use for each project stage:
(shortest time + 4 x likely time + longest time) / 6
This helps to bias time estimates away from the unrealistically short time-scales normally assumed. If tasks are sequential, show which stage they depend on.
Step 2: Input Activities into Software or a Template
You can draw your charts by hand or use specialist software, such as PERT, Matchware or Microsoft Project. Some of these tools are cloud-based, meaning that you and your team can access the document simultaneously, from any location. (This helps a lot when you're discussing, optimizing, and reporting on a project.) Several PERT templates have been created for Microsoft Excel, and you can also find free templates with a quick search online.
Figure 3: Example of a PERT chart.
Page 2 of 5
Testimonial
"In a year when every marketing dollar mattered, I chose to keep I-Connect007 in our 2025 plan. Their commitment to high-quality, insightful content aligns with Koh Young’s values and helps readers navigate a changing industry. "
Brent Fischthal - Koh YoungSuggested Items
HyRel Technologies Showcases Summer Intern Success Through Hands-On Innovation
09/16/2025 | HyRel TechnologiesHyRel Technologies, a global provider of quick turn semiconductor modification solutions, proudly highlights the accomplishments of its two recent summer interns, Danny Hoang and Nisarg Jadav.
Automation Meets Sustainability
09/08/2025 | Rick Nichols, GreenSource EngineeringGreenSource Engineering (GSE) is proud to have contributed to the first successful reshoring of a PCB facility on a greenfield site in the United States. While we are honored to have played a key role, full credit for this achievement goes to SEL for its vision, commitment, and professionalism.
Japan’s OHISAMA Project Aims to Beam Solar Power from Space This Year
07/14/2025 | I-Connect007 Editorial TeamJapan could be on the cusp of making history with its OHISAMA project in its quest to become the first country to transmit solar power from space to Earth, The Volt reported.
Connect the Dots: The Future of PCB Design and Manufacturing
07/02/2025 | Matt Stevenson -- Column: Connect the DotsFor some time, I have been discussing the increasing complexity of PCBs and how designers can address the constantly evolving design requirements associated with them. My book, "The Printed Circuit Designer’s Guide to… Designing for Reality," details best practices for creating manufacturable boards in a modern production environment.
Project GENESIS Minimizes Ecological Footprint in Europe’s Semiconductor Industry
06/06/2025 | Fraunhofer IPMSA pan-European consortium dedicated to developing sustainable processes and technologies for the semiconductor-manufacturing supply chain announces the launch of the GENESIS project.


