


 The Knowledge Base: A CM’s Perspective on Box Build Practices
 SMT Prospects and Perspectives: AI Opportunities, Challenges, and Possibilities, Part 1
 Nolan’s Notes: Do More, Get More
Divergence in Test Results Using IPC Standard SIR and Ionic Contamination Measurements
August 1, 2016 | Karen Tellefsen, Alpha Assembly SolutionsEstimated reading time: 8 minutes
Controlled humidity and temperature controlled surface insulation resistance (SIR) measurements of flux covered test vehicles, subject to a direct current (DC) bias voltage, are recognized by a number of global standards organizations as the preferred method to determine if no-clean solder paste and wave soldering flux residues are suitable for reliable electronic assemblies. The Association Connecting Electronics Industries (IPC), Japanese Industry Standard (JIS), Deutsches Institut fur Normung (DIN) and International Electrical Commission (IEC) all have industry reviewed standards using similar variations of this measurement.
Ionic contamination testing is recognized by the IPC as a standard for evaluating the cleanliness of assemblies that have been subjected to a cleaning process. IPC J-STD001F calls for a cleanliness level of
IPC-TM-650 Method 2.3.25 contains standard test methods for extracting contaminants from circuit boards using heated isopropanol (IPA) / water mixtures. Test method 2.3.25 is commonly referred to as the ROSE (resistivity of solvent extract) test. Previous work1,2 has shown poor correlation between the presence of extractable, corrosive weak organic acids and results from IPC-TM-650 2.3.25 test results, partially due to the lack of solubility of materials found in no-clean fluxes, and the higher SIR values imparted by rosins and resins in modern no-clean soldering materials.
This study will compare the results from testing two solder pastes using the IPC-J-STD-004B IPC TM-650 2.6.3.7 surface insulation resistance test and IPC TM-650 2.3.25 in an attempt to investigate the correlation of ROSE methods as predictors of electronic assembly electrical reliability.
Introduction
Ionic contamination testing has been traced back to work done at the United States Naval Avionics Center in Indianapolis in the early 1970s by Hobson and DeNoon3. This work eventually led to the development of the 1.56 µg/cm2 (10 µg/inch²) NaCl equivalent standard for ionics extracted using an IPA/water mixture. High volume circuit assembly at the time used only wave soldering processes, employing foam fluxers to apply RMA flux followed by a post soldering cleaning process with fluorocarbon solvents.
This ionic contamination limit became part of now defunct Mil Spec P-288094 and Mil STD-2000A, but has been carried through versions A through F of ANSI/J-STD-001. This manual procedure has become more automated with the invention of descriptively branded test equipment such as the Contaminometer, Ionograph and Omega Meter. Although these measuring devices improve the efficiency and accuracy of measuring ionic contamination soluble in alcohol/water mixtures, they also increase the amount of ionic material measured5, 6.
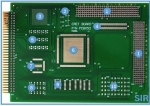
IPC-9202 describes a procedure for qualifying a process for electrical reliability by measuring SIR using IPC TM-650 2.6.3.7 and IPC TM-650 2.3.28 by using the IPC-B-52 test coupon. This coupon is shown in Figure 1. The standard calls for a minimum SIR value of 100MΩ, but only calls for a measure and report of the ionic contamination. The reported ionic contamination then becomes a benchmark for “future trouble shooting or process improvement efforts.”
The experiments carried out in this work were designed to use methodology derived from IPC-9202 to determine if it is possible to have a solder paste that passes SIR standard of >100 MΩ, but fails the ionic contamination level of ANSI/J-STD-001f, and determine if a second solder paste fail the SIR test and pass the ROSE test standard.
Figure 1: IPC B-52 test coupon comprising a SIR test coupon (SIR) and a section for ionic contamination measurements (SIR). Component ID: 1 – TH connector 4 x 24 pins; 2 – Capacitor, 10 pF, 0402 package; 3 – BGA, 256 IO, 1 mm pitch, isolated; 4 – SM connector IEEE 1386, 2 x 16 pins; 5 – Capacitor, 10 pF, 0805 package; 6 – QFP160, 0.65 mm pitch, isolated; 7 – QFP80, 0.5 mm pitch, isolated; 8 – Capacitor, 10 pF, 0603 package; 9 – SOIC16, 1.27 mm pitch, isolated; 10 – Capacitor, 10 pF, 1206 package.
Methodology
Two different SAC305 solder pastes were printed and reflowed on IPC B-52 test coupons (Figure 1). The assembled coupons were broken into two separate test vehicles after the solder pastes were printed, populated and reflowed. The section of the board on the center right was used to measure ionic contamination. The left portion of the test vehicle was used to measure SIR. The four smaller panels on the far right were discarded. A schematic diagram of the Ionograph that was used is depicted in Figure 2. The Ionograph is considered a “dynamic” ROSE measurement in which the extraction solution is continuously passed through ion exchange columns that remove the ionic material in the solution. A conductivity bridge detects ions in solution, and a flow meter measures the volume of solution passing by the conductivity bridge, allowing ionic contamination to be integrated with extraction solution volume.
A second measurement using three IPC-B-24 coupons (usually used for single material SIR measurements) for each of the two pastes was made.
Figure 2: Schematic diagram of the “Ionograph.”
Page 1 of 4
Share on:


Suggested Items
HQ NextPCB of HQ Electronics Debut on the International Stage for Electronics Manufacture at IPC APEX 2024
05/01/2024 | PRNewswireHQ NextPCB of HQ Electronics, a leading Chinese-based multilayer PCB manufacturer and assembly house showcased its industrial prowess on the international stage for the first time at the IPC APEX Expo 2024.
IPC's Vision for Empowering PCB Design Engineers
04/30/2024 | Robert Erickson, IPCAs architects of innovation, printed circuit board designers are tasked with translating increasingly complex concepts into tangible designs that power our modern world. IPC provides the necessary community, standards framework, and education to prepare these pioneers as they explore the boundaries of what’s possible, equipping engineers with the knowledge, skills, and resources required to thrive in an increasingly dynamic field.
North American EMS Industry Down 4% in March
04/29/2024 | IPCIPC announced the March 2024 findings from its North American Electronics Manufacturing Services (EMS) Statistical Program. The book-to-bill ratio stands at 1.31.
Real Time with… IPC APEX EXPO 2024: A Global Presence in PCB Manufacturing
04/29/2024 | Real Time with...IPC APEX EXPORob DiGiovanni, VP of sales for the Americas at STARTEAM Global, discusses the company's global presence in PCB manufacturing. As he explains, the firm operates facilities across Europe, Asia, and North America, specializing in serving contract manufacturers in the automotive and medical industries. They emphasize quality and meeting OEM standards, focusing on offshore supply and non-Chinese factories in the North American market. The company has grown through acquisitions and rebranding to offer multiple products.
EIPC Issues Letter of Urgency
04/29/2024 | Alun Morgan, EIPCAlun Morgan, president of EIPC, issued a letter last week in an effort to raise awareness of the state of PCB manufacturing in Europe. He writes, "The European PCB manufacturing industry and its supply base has been steadily shrinking since the dot com crash at the start of the millennium. European demand for PCBs and assemblies has, however, continued to grow, thus creating an ever-widening gap between European domestic capacity and consumption. The risks posed by this imbalanced supply and demand pattern came into sharp focus during the Covid-19 pandemic which caused chaos in extended supply chains across the world and resulted in widespread shortages."