


 Powering the Future: Why True Ceramic Circuits Are Not Just ‘Better PCBs’
 Global Sourcing Spotlight: The Global Quality Gap—Why Consistency Wins the Contract
 Knocking Down the Bone Pile: Precision Milling of Underfilled SMT Components


Chapter 2: SMT Process: A Treasure Trove of Data
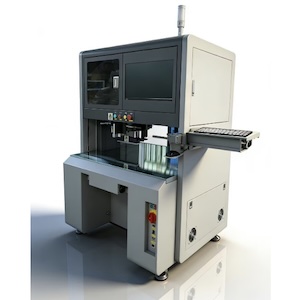
As the central workhorse of the PCB assembly process, the SMT line is where most of the action happens for electronics manufacturers. While there are a variety of different configurations possible for an SMT line, for the purposes of this book, let’s assume an SMT line consists of the following: solder paste dispensing machine followed by a screen printer machine, solder paste inspection machine, two placement machines, a reflow oven, ending with an automated optical inspection (AOI) machine (Figure 2.1).
The SMT line contains a treasure chest of analytics: ripe with rich data, the different analytics available within this process likely number somewhere in the hundreds (depending on your preferences for nuances and slicing and dicing numbers). In the same vein as a vendor agnostic connectivity solution, the most effective analytics platform will also be vendor neutral. And while multiple tools may be used throughout the factory, it is critical that, within each of these tools, the data is being normalized the same.
Regardless of the type of analytics tool in use, especially considering the chosen platform will likely evolve over time, the data must be normalized and labelled uniformly. Snapshots from each machine interface will not be enough, nor will it be efficient when looking to better understand the comprehensive performance of the factory—or for many manufacturers’ factories.
In this chapter, we’ll focus on the most important analytics at the forefront of SMT, from the solder paste machine to placement machines, and breakdown these metrics from the perspectives of the different decision makers involved in the process. The lead SMT shift manager isn’t going to have the same concerns as a quality manager, so it’s important to look at how each machine and operation contains valuable KPIs for each role.


